This week’s big decline in stock prices has us all wondering … Is that it? … or … Is it the beginning of something bigger?
When it comes to volatility, static allocators have it easy … what to do – if anything – just depends on whether you’re under or over your target allocation. If you’re a trader or dynamic allocator, it’s different … Buy the dip or sell the rip?
Let’s take a look at the situation from four different perspectives. First we’ll take a look at valuations – the best indicator of prospective long term returns. We’ll consider the credit cycle. Then we’ll look at market breadth and internal divergences. Finally we’ll take a look and see what our computer models have to say.
So much excellent work has been done on valuations we see no need to reinvent the wheel here. Readers are invited to consult Research Affiliates, GMO, and John Hussman, whose analyses have been widely cited in the financial media. This expert consensus is that US stock valuations are at or near all time highs. This strongly implies that returns in the coming years will be much lower than long term historical averages. Even long term investors should pay attention to valuations.
Let’s be clear that applies specifically to US stock valuations. The rest of the world’s stock market – roughly half the global market equity value – is, within the parameters of this inexact science, much more fairly valued. This implies that returns in coming years on non-US stocks will resemble long term historical averages. And in particular, are likely to significantly outperform US stocks. The stock market as a whole, including the US and non-US parts, is richly valued, although not to the stratospheric levels in the US sector alone. While acknowledging that valuations have little to say about near term market performance, the mere fact that the near term is going to be part of the long term means that little is not the same as none. High valuations have been a negative bias on stock market prices for some time; they have just been overwhelmed by other factors such as ultralow interest rates and market momentum. Erosion of support from those other factors leaves valuation with less competition.
Years of these ultralow interest rates have spurred record levels of debt. As rates normalize, this debt grows increasingly expensive to service, siphoning funds away from other uses like consumption and investment. Higher yielding lower priced bonds become more competitive with high priced low yielding stocks, a toxic atmosphere for the sustainability of bubble level valuations.
Market breadth is a more timely indicator. Are the bulk of stocks moving in the same direction as the market averages? Or are the averages being levitated by just a few? Of late the answer here is clearly the second. Hussman’s latest post covers this in more detail. Within the US stock market, many more stocks have been weakening than strengthening, and those that have been rising have been able to sustain the cap weighted averages by virtue of being heavily weighted megacap names. Historically these kind of divergences tend to be resolved by the few turning to join the many … which in this case means those megacaps join the rest in heading down, and the market averages with them.
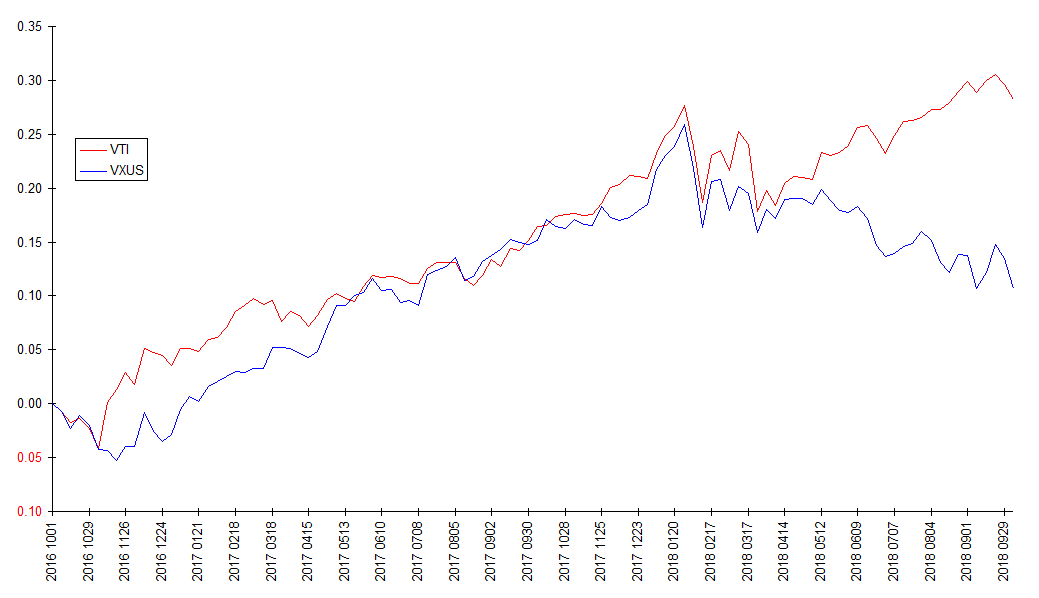
Over the past few months we’ve been seeing another kind of divergence. The non-US part of the stock market peaked in January and has been declining since, even as the US part of the stock market resumed its ascent after the selloff early this year. This is partly a reflection of the influence of those megacap names on the US averages mentioned above. This is most clearly evident in the following chart. Here we’re looking at the price performance (logarithmic scale) of Vanguard’s US Total Market fund VTI and Total International Stock fund VXUS from October 1 2016 to October 1 2018 (note this excludes this week’s crashlet). These two funds reflect virtually the entire US and non-US portions of the world stock market respectively. Note the stunning divergence that developed after the selloff early this year. The rest of the world’s stock market has been in a bear market for most of the year.
The US market looks like Wile E Coyote after stepping off the edge of a cliff, but before looking down and realizing it.
What about the world stock market as a whole? As represented by the FTSE All World All Cap index (and the Vanguard Total World Stock fund VT that tracks it), it has still not returned to the January highs. Financology goes by the traditional definition of a bear market as any decline extended in time; so by that criterion stocks have been in a bear market since January 26.
Only the US stock market, and still more specifically a minority of large cap stocks, have failed to join in. The evidence is compelling that those high valuations are not only destined to revert, but may already be in the process of reversion.
Financology’s computer models, Synthetic Systems, concur. The below is a chart of the latest update previously posted on the Quartely Charts page (site menu, Market Analysis).
Synthetic Systems 2018.75